New technical analysis, from the hand of BELOBABA. Ethereum could find itself in short-term resistance zones. Jesús Sánchez-Bermejo, CIO (Chief Investment Officer), explains this possibility to us.
The shoulder - head - shoulder figure is a visual configuration that is usually found on price charts of financial assets. This and other typical figures are studied by technical analysis, which is a stock market analysis methodology. And every day it is also used for the world of crypto assets.
Both the HCH and HCH inverted figures have reversal implications, but sometimes we can find a head and shoulders shoulder within a downtrend, usually in intermediate phases.
The important thing about this, in relation to the current situation for ethereum, is that it could be true, as well as false.
In the following graph, the truth:
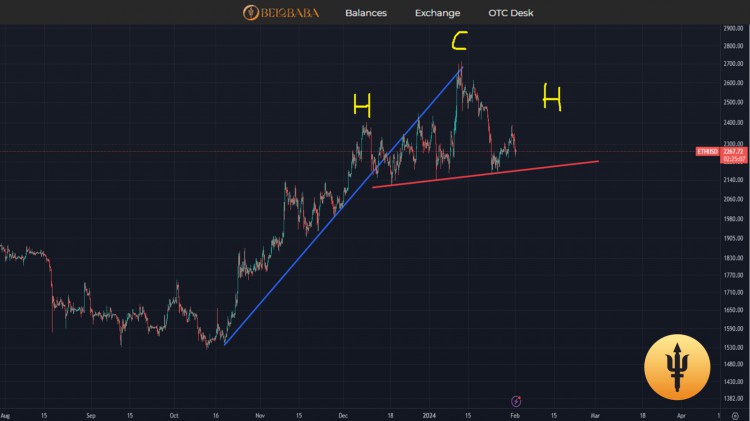
Chart shown: Ethereum after losing the accelerated bullish trend started in October 2023.
In the following graph, the possible falsehood of HCH.
The possibility that Ethereum is making a movement in a complete structure that began in June 2022 and is still in development implies that over time, the price would have to collide with resistance in its creation of structure.
In this possibility that I explain, Ethereum could be developing a theoretical Fibonacci structure, with resistance points, (thinking that its start is at 882 USD and that its end is at 3871 USD), with resistance points in 2024, coinciding with important fibo , support at 1521, with support at important fibo and start of initial movement of October 2023, resistance at 2729 USD, coincident with important fibo and new resistance at 2352 USD, coincident with important fibo and creating an HL (high low / descending maximum) in a possible waiting situation after short-term resistance.
I understand that for people less experienced in technical analysis, their objective will be to observe how it goes up and down, and down and up, and up again and up a lot, right? But prices do not move in a straight line and an analysis of this type, it can shed some light on how a price moves, in theoretical mathematical structures, applied to technical analysis.
Repeating: The possibility that it is developing a Fibonacci structure, which if correct, could lead to the price not meeting the HCH objective, but rather its full objective would not be completed and the price could go down but less. I understand that, yes, to possible areas close to approximately 2030/2020 USD, with extension to prices closer to 2000 USD itself. All this, while waiting in time and space, while the bitcoin halving approaches (the typical lateral after a rise, to consolidate a conquered area).
Likewise and as we say in BELOBABA with what has happened several times in the past; If a halving is approaching, then in general, almost everything goes up. But each person must be responsible for their own investments, since what is stated here should not be taken as an individual or collective investment recommendation.

It is interesting to understand the already short history of bitcoin and that the norm, to date, is:
That the movements in general are started by bitcoin, followed by ethereum and other large cryptos, then intermediate cryptos in liquidity and finally the less liquid altcoins. Will it happen like this again?
If this rule were met, Ethereum would now have a possible lateral movement, with some volatility and a slight downward trend in the background, to then rise again and in the future, comply with this possibility explained in the Fibonacci structure.
What will happen in the end? Nobody has a crystal ball here, but take a look at the technical explanation presented.
And if HCH is met, the price should head towards $1800 areas, you have to keep that in mind. And if it rises from today, forget this analysis with a view to the future at the next theoretical great level to reach, which could be around areas of 3166 USD. But for this price, there is still a lot to tell. Good luck in your investment decisions.
Greetings to all.
This content is for informational and educational purposes. There is no consumer protection. Your capital is subject to risks. It is not a recommendation to buy or sell crypto assets. Do your own research or contact your trusted financial advisor.
Jesus Sanchez-Bermejo
Source: Territorioblockchain.com